Why Silica Powder Particle Size Distribution Matters
Understand how particle size distribution affects silica powder packing, flow, dispersion, and process consistency.
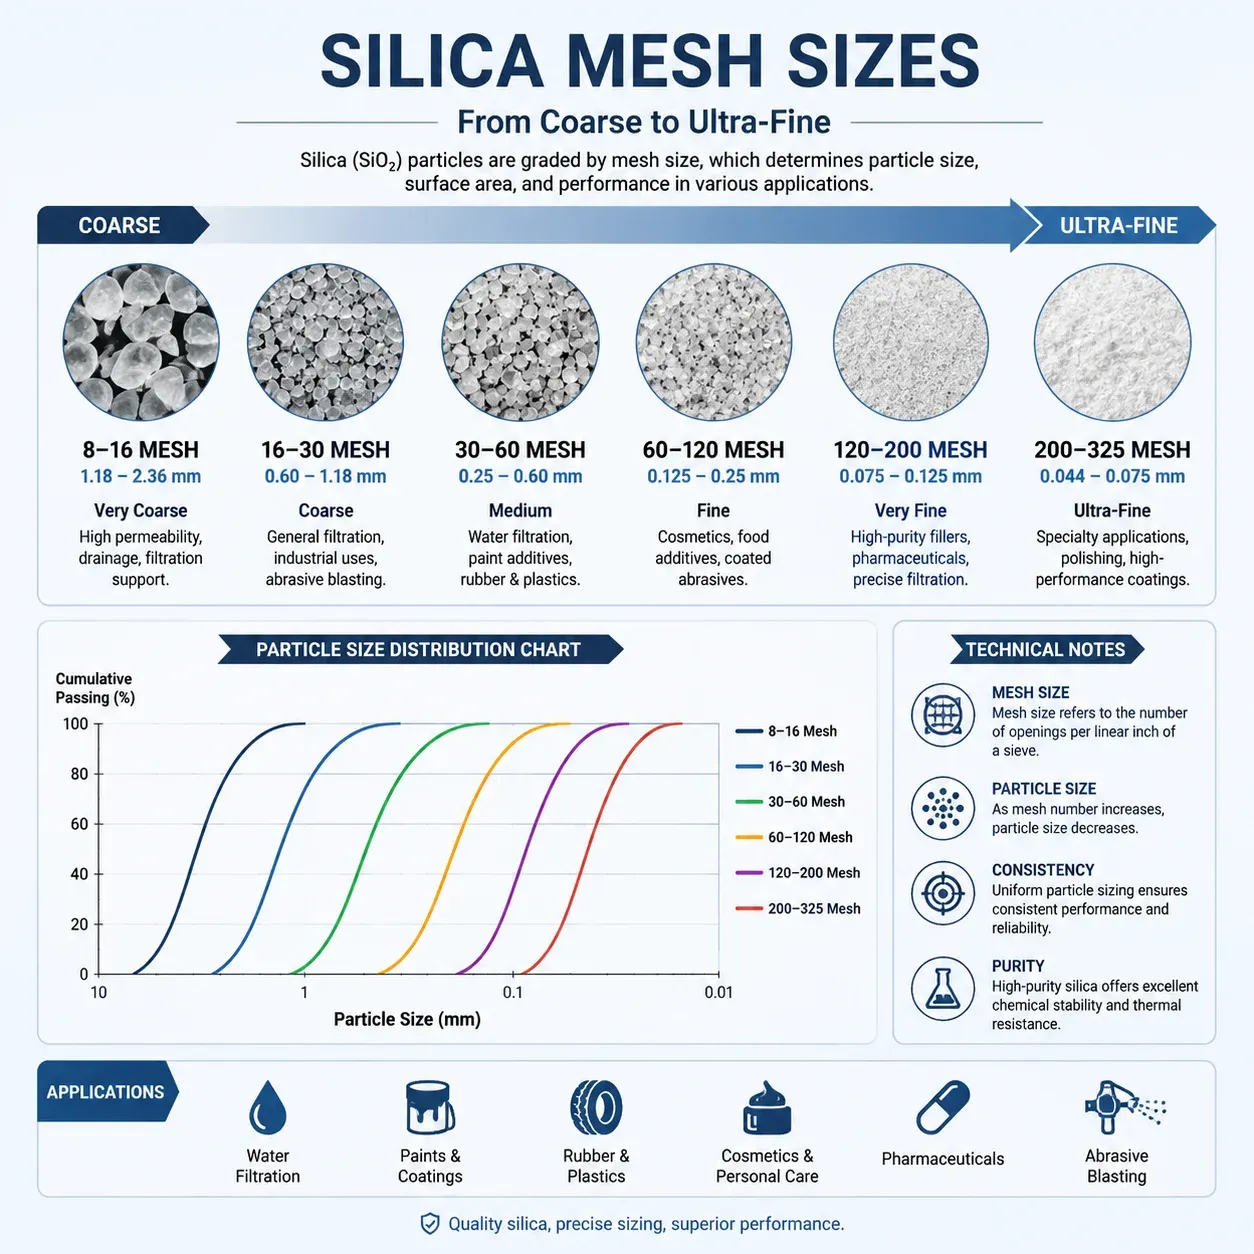
Particle size distribution (PSD) explains why two silica powders with similar chemistry can behave differently.
The coarse tail affects defects and oversize; the fine fraction affects packing, surface area, wetting, dust and sometimes viscosity. A useful specification therefore states the measurement method and distribution—not only a mesh name or SiO2 value.
Last updated:
What D10, D50 and D90 Tell You
| Term | Meaning | Why a buyer may care | Limit of interpretation |
|---|---|---|---|
| D10 | 10% of the measured distribution is finer than this value, according to the stated method. | Shows the fine end and can help compare wetting, surface area or filler packing. | Not a direct measure of chemistry, shape or performance. |
| D50 | Median particle-size position of the measured distribution. | Provides a compact comparison point between lots. | Two powders can share a D50 while having very different tails. |
| D90 | 90% of the measured distribution is finer than this value. | Highlights the coarse tail that may affect finish, defects or sieve residue. | Does not replace a separate oversize or retained-percentage limit. |
How PSD Changes Processing Behavior
Packing and void filling
A broad distribution can allow smaller particles to occupy spaces between larger particles, but the result depends on particle shape, agglomeration, surface treatment and the formulation. A tighter cut can improve predictability while changing bulk density or resin demand.
Flow and feeding
Fine particles increase cohesive forces and may bridge or feed unevenly. Moisture, surface chemistry and storage history can amplify the effect, so the PSD should be read together with moisture and handling observations.
Dispersion, wetting and viscosity
Finer material generally presents more surface area to a binder or resin. That may change wetting demand, viscosity and mixing energy. It is an application relationship, not a universal rule that finer always performs better.
Mesh Data and Laser PSD Answer Different Questions
Example: what Changtong's COA actually reports
The December 2025 RG400/RG600 fused silica COA illustrates why a mesh reference should not be converted into a laser-diffraction percentile.
| Reported item | Value or status | Correct interpretation |
|---|---|---|
| 200 mesh | 75 µm nominal opening | Sieve reference; read with the COA's pass-range fields. |
| 325 mesh | 45 µm nominal opening | Sieve reference; read with the COA's pass-range fields. |
| D10/D50/D90 | Not reported in this COA | Do not infer laser-diffraction percentiles from the mesh labels. |
Source: Changtong fused silica COA, December 2025, RG400/RG600. This is a sieve/pass example, not a D-value dataset.
| Specification element | Best control question | Recommended reporting |
|---|---|---|
| Sieve residue | How much coarse material remains above a defined opening? | Test sieve standard, sample mass, sieve result and acceptance limit. |
| PSD percentiles | How is the distribution positioned across fine, median and coarse ranges? | D10/D50/D90, instrument method, dispersion condition and units. |
| Application validation | Will the grade work in this resin, slurry, shell or compound? | Formulation, loading, mixing conditions and agreed performance checks. |
ISO 13320 covers laser-diffraction particle-size analysis. The standard does not turn a measurement into a universal end-use guarantee; the sample preparation and dispersion method still need to be stated.
Public industry reference: a reported Dv50 example
A public Hoben C200 cristobalite technical data sheet reports a typical Dv50 of 219 µm and separately reports sieve fractions. This is an industry reference from another supplier and material; it demonstrates why a D-value must be quoted from the actual test report rather than inferred from a mesh label.
Reference: Hoben C200 Cristobalite Technical Data Sheet. Not a Changtong specification.
How to Compare a Silica Powder Lot
- Use a representative sample tied to a lot number.
- Check whether the result is a sieve limit, a PSD percentile, or a supplier's nominal grade label.
- Compare the same test method and sample preparation across suppliers.
- Review the coarse and fine tails, not only D50.
- Confirm chemistry, moisture, packaging and application trial results separately.
For selection, compare the buyer's process with the relevant 325-mesh fused silica powder, investment-casting fused silica powder, or High-Whiteness Cristobalite Powder for Epoxy and Refractory Applications specification. Ask for the current data sheet and lot COA before treating a value as a purchasing limit.
Frequently Asked Questions
Is a narrower PSD always better?
No. The suitable distribution depends on packing, flow, surface finish, binder demand and process tolerance. A narrower cut can improve repeatability but may not give the best formulation balance.
Can D50 replace a mesh requirement?
Usually not. D50 does not control the coarse tail. If oversize matters, keep a defined sieve or retained-percentage requirement alongside PSD.
Why can the same grade change viscosity?
PSD, moisture, agglomeration, surface treatment, mixing energy and resin chemistry can all change the effective interaction. Investigate the method and lot data before changing only the nominal grade name.
References
- ISO 13320 — Particle size analysis by laser diffraction methods.
- ASTM E11 — Test sieves and sieve cloth.
Request the Distribution That Matches Your Process
Share the material, application, mesh or micron target, test method, chemistry limits and required documents so the grade can be evaluated on comparable evidence.
Contact our technical sales team